
 Notizie
Abbiamo bisogno del gasdotto EastMed?
Read more 
Monthly observatory of the EU car market and the 2025 emissions gap

With the next stage of the European Union’s new CO₂ emission targets for light vehicles taking effect in 2025 (-15% compared to 2021), the EU automotive sector faces a decisive challenge. As the transition toward zero-emission electrified mobility accelerates, monitoring the car market becomes a useful benchmark for assessing manufacturers’ strategies in response to the new emission reduction targets.
To inform the debate with updated and reliable data, ECCO, in collaboration with ICCT and IDDRI–IMT, publishes monthly information on the average specific emissions of new vehicle fleets introduced into the market by manufacturers operating in the European market, as well as their distance from 2025 reduction targets.*
The monitoring will be accompanied by additional details on car registrations by propulsion type (BEV, PHEV, HEV, MHEV) and quarterly updates on the development of charging infrastructure and the registration of light commercial vehicles.
Through these updates, we aim to provide an assessment tool for car manufacturers, analysts, policymakers and all stakeholders involved in the transition to zero-emission mobility.
*The targets are estimated on a monthly basis according to the methodology adopted by Regulation 631/2019, amended by Regulation 851/2023, based on the evolution of YTD sales by vehicle type and characteristics.
Download the full report by ICCT, ECCO and IDDRI-IMT
In April 2025, carbon dioxide (CO2) emissions among manufacturer pools averaged 102 g CO2/km in April 2025. As a result, manufacturing pools are 9 g CO2/km from the average target of 93 g CO2/km for the 2025–2027 period, in accordance with the revision of the Regulation on emission standards for cars, as proposed by the European Commission and approved by the European Parliament on 8 May. Among the manufacturer pools, the BMW pool is currently in compliance with its target for the three-year period 2025-2027, Mercedes-Volvo-Polestar are at 3 gCO2/km, Renault at 5 gCO2/km, Tesla-Stellantis-Toyota at 8 gCO2/km. With April sales, Volkswagen recovers 2 gCO2/km, reducing its gap to the target to 14 gCO2/km, while Nissan, with 29 g CO₂/km above the target, is the manufacturer farthest from achieving its target. All values take into account the compliance credits provided for in the regulation.
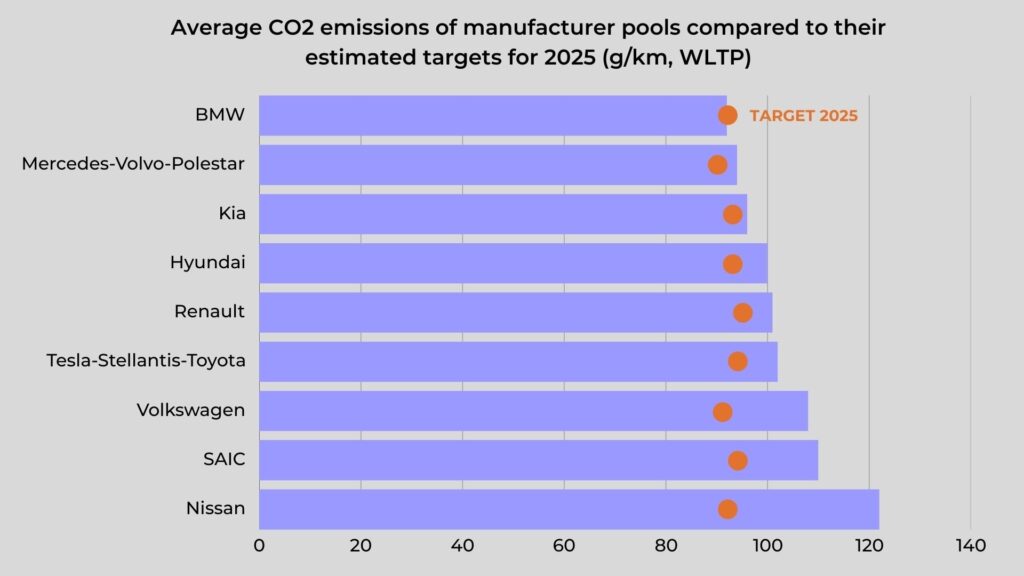
Average emissions, distance from target and market share by pool of manufacturers
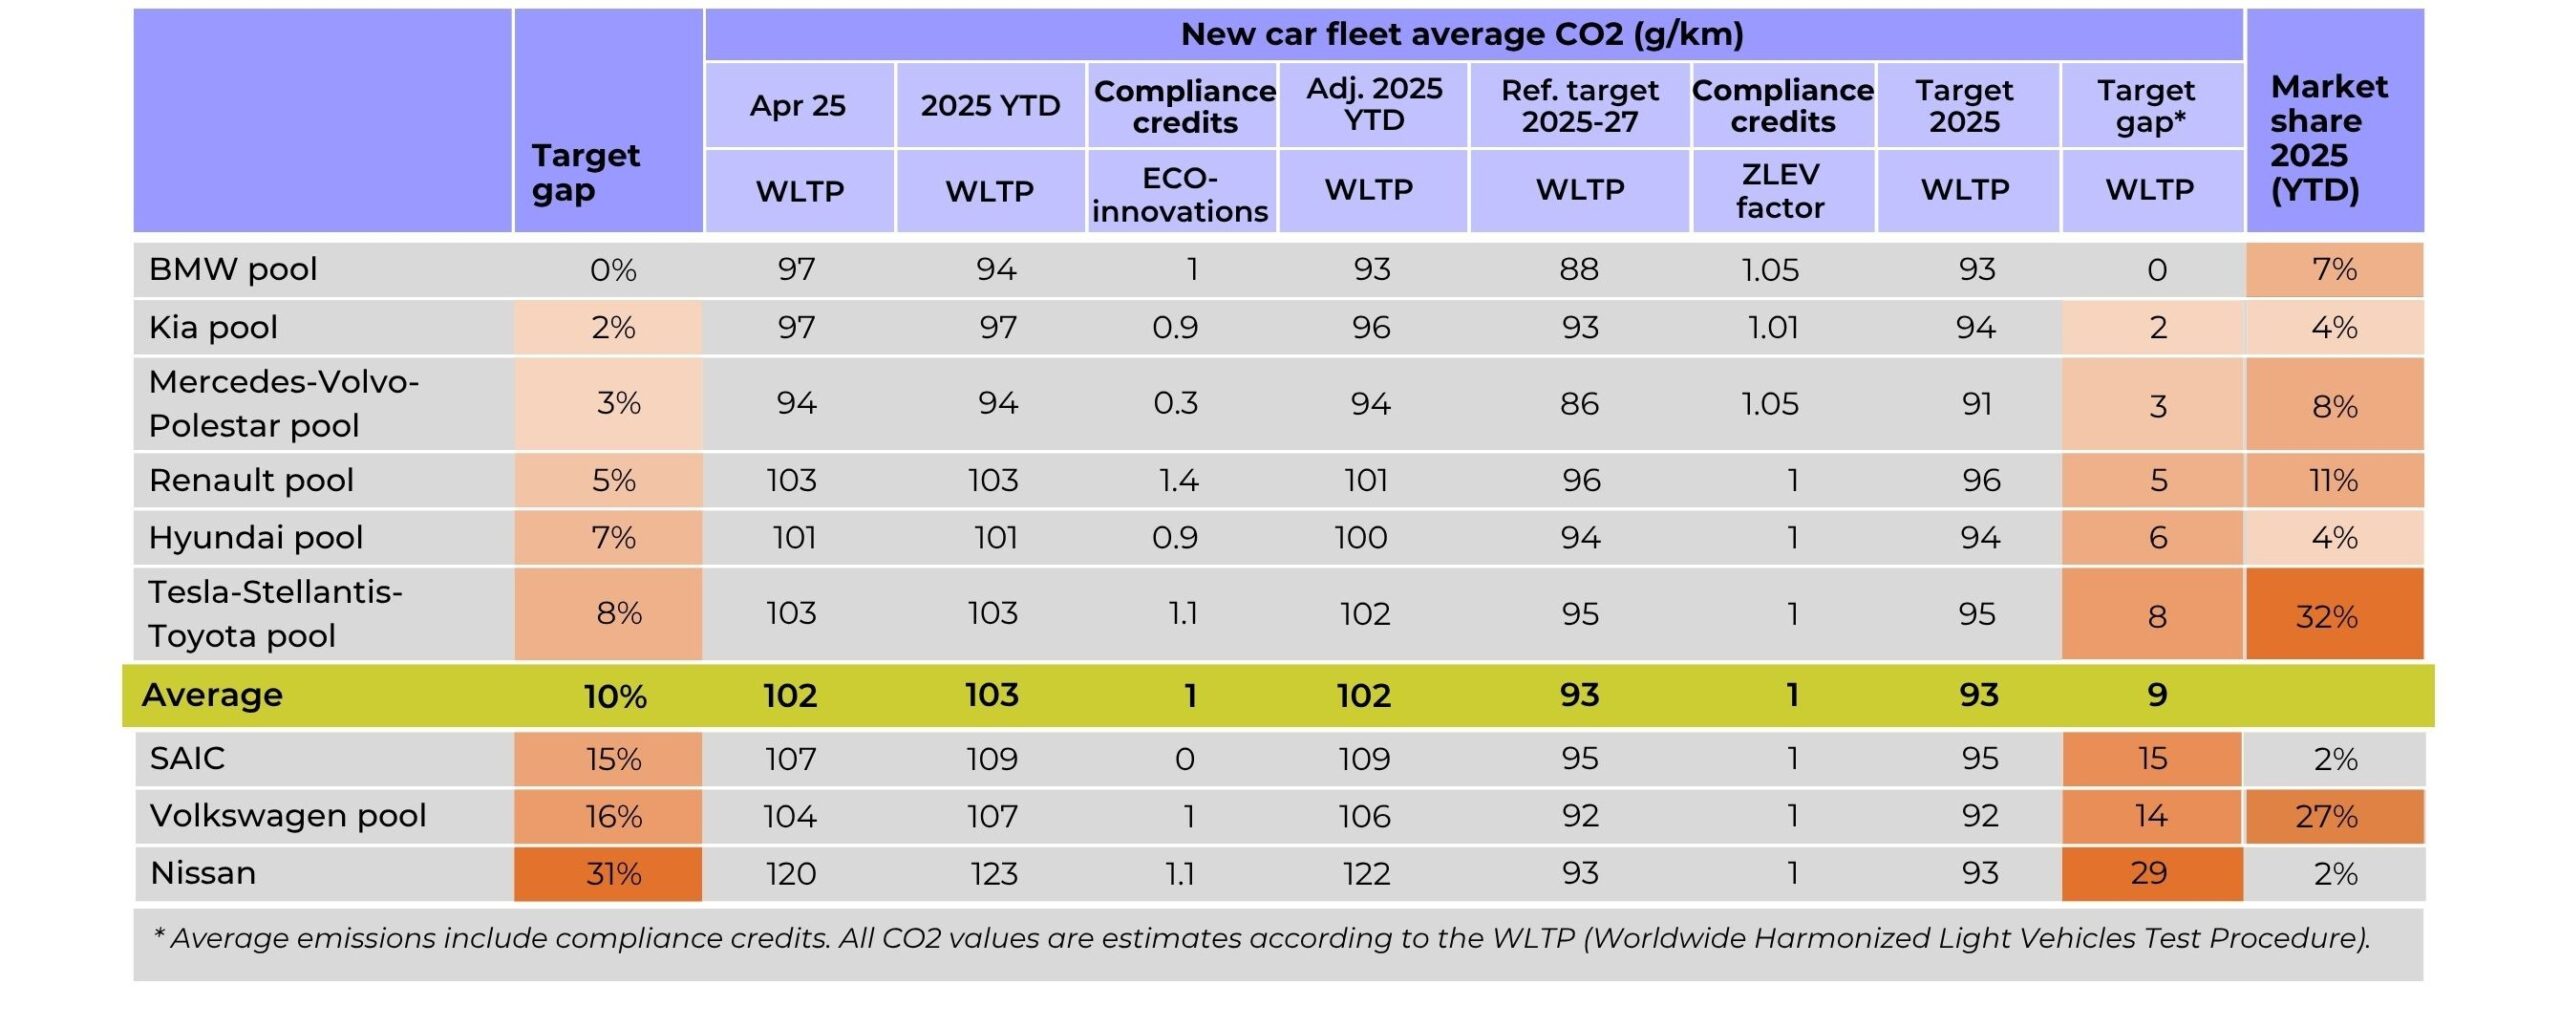
Looking at individual car brands with market shares of 1% or greater, apart from Tesla, after four months on the market Volvo had the greatest over-compliance at 27 g CO2/km below its projected brand level average target for 2025–2027, and it was followed by Cupra (17 g CO2/km below target). Mazda and Nissan currently have the largest target gaps at 29 CO2/km each. While Audi’s target gap remains sizable at 28 CO2/km, that is a 2 g CO2/km reduction from the previous month, and Ford (25 CO2/km) and Mercedes-Benz (23 CO2/km) also reduced their target gaps by 1 CO2/km each. Among the Stellantis brands, Peugeot (+8 gCO₂/km) is performing best, while Fiat, with average emissions for its fleet sold at 126 gCO₂/km, is performing worst, 19 gCO₂/km above its target.
Average emissions, distance from target and market share by manufacturer group and brand

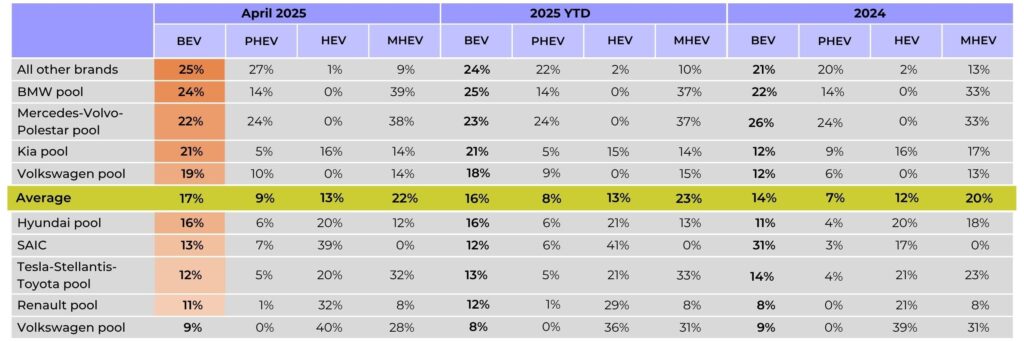
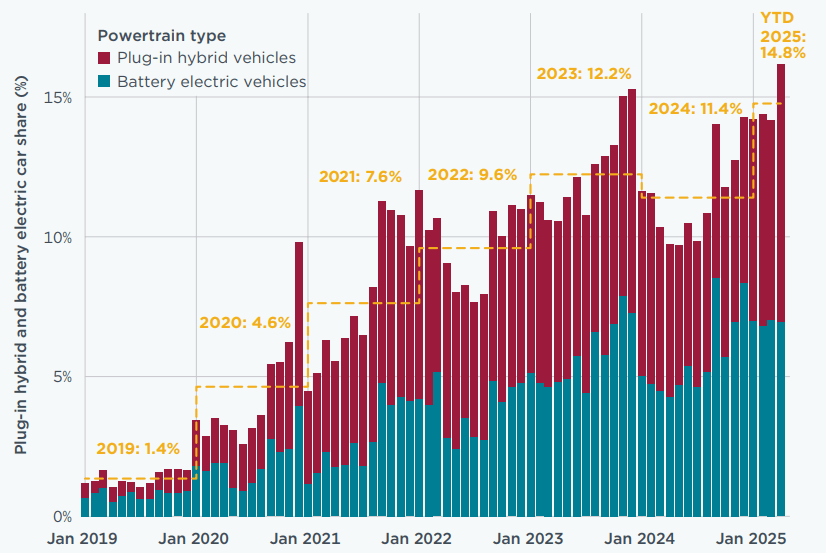
The average distance from the targets highlighted above can be explained by looking at registrations of zero- and low-emission vehicles. The average share of battery electric vehicles (BEVs) among total new registrations in Europe increased 1 percentage point to 17% in April 2025, up from 16% in March. While several manufacturer pools had decreases in BEV shares of 1 or 2 percentage points in April compared with the previous month, including the BMW, Mercedes-Volvo-Polestar, Hyundai, Tesla[1]Stellantis-Toyota, and Renault pools, other pools increased their shares. The 19% BEV share of the Volkswagen pool was a notable jump of 7 percentage points over its 2024 average. The BMW pool had the highest BEV share in April (24%) and was followed by Mercedes-Volvo[1]Polestar (22%) and Kia (21%). The Hyundai pool (16% BEV share) was below the European average, as were SAIC (13%), the Tesla-Stellantis-Toyota pool (12%), the Renault pool (11%), and Nissan (9%). S
Shares of plug-in hybrid electric vehicles (PHEVs) among new registrations in Europe increased slightly to 9% in April (from 8% in March 2025), and the Mercedes-Volvo-Polestar pool led with a 24% PHEV share. Nissan had the largest share of full hybrid electric vehicles (HEVs) in April (40%) and the BMW and Mercedes-Volvo-Polestar pools led in new registration shares of mild hybrid electric vehicles (MHEVs) at 39% and 38%, respectively.
Share of BEV, PHEV, HEV and MHEV by manufacturer pool
Looking at the major European markets, total passenger car registrations in France, Belgium, and the Netherlands fell 6%, 5%, and 4%, respectively, in April 2025 compared with April 2024, and Italy surpassed France in market size. New registrations increased 16% in Austria, 10% in Sweden, and 9% in Czechia compared with April 2024.
In the four month period, combined BEV and PHEV market shares held steady at 24% in Europe YTD in 2025. Norway (96%), Denmark (68%), Sweden (59%), and the Netherlands (53%) all had combined shares above 50%, and Belgium (41%), Austria (30%), and Germany (27%) also recorded combined BEV and PHEV market shares above the average for Europe.


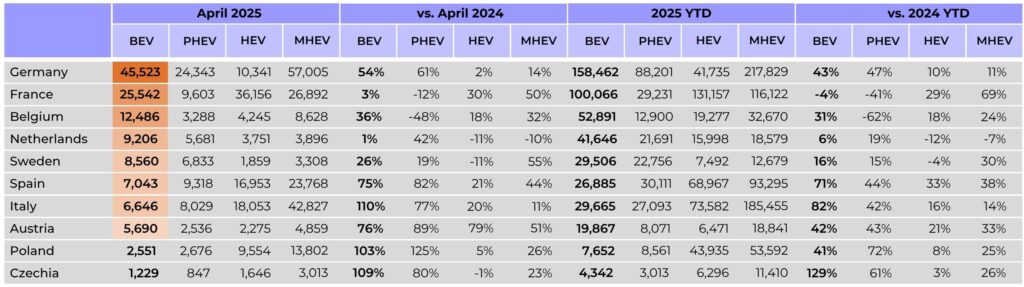
Among the largest markets, the highest increase in BEV registrations occurred in Italy, Czechia, and Poland, where registrations increased 110%, 109%, and 103%, respectively, in April 2025 compared with April 2024; registrations in France and the Netherlands remained similar to April 2024. In Germany, BEV registrations continue to rise, with over 45,500 BEVs registered in April, a market share of 19%. As Europe’s largest market, Germany’s 54% increase in total BEVs registered over April 2024 is noteworthy. Registrations of PHEVs increased the most in Poland (+125%) in April 2025 compared with April 2024 and HEV registrations increased the most in Austria (+79%). Shares of MHEVs were the highest in Italy (31%) and Poland (29%) in April, and they are gaining popularity in Sweden, Austria, and France, where registrations increased 55%, 51%, and 50%, respectively, in April 2025 compared with April 2024.
New BEV, plug-in hybrid, full hybrid and mild hybrid passenger car registrations by country
Share of new BEV, plug-in hybrid, full hybrid, and mild hybrid passenger cars by country

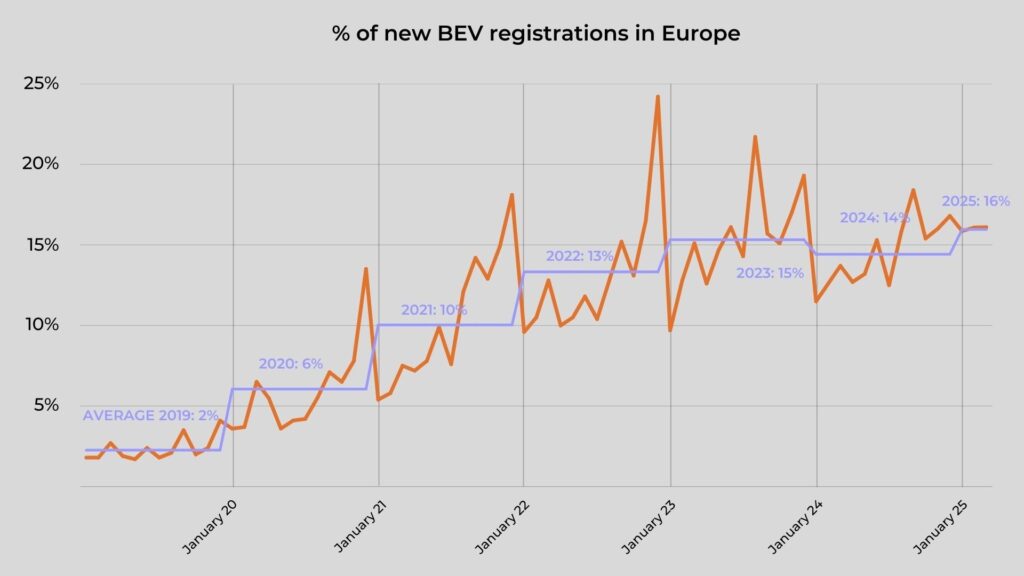
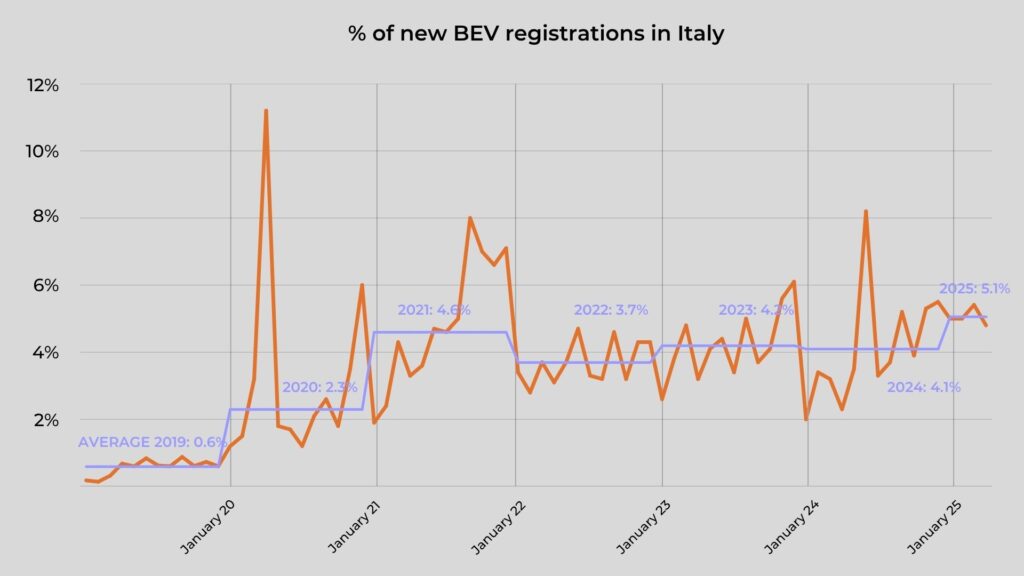
Historical trend of the share of new BEV registrations in Europe and Italy
At an aggregate level, the historical trend in BEV sales in Europe continues to grow compared to previous years. In Italy, too, the trend remains positive compared to the historical trend, albeit with a much less pronounced curve. Given the growth in sales compared to 2024, as reported above, the decline in the trend for April is due to exceptional sales recorded in Italy in March.
In Spain, registrations of new BEVs and PHEVs are showing strong growth in 2025, with YTD sales up 55% compared with the same period in 2024. Total new passenger car registrations YTD increased by 13% over the same period in 2024. This growth is partly driven by a surge in vehicle sales in the Valencian Community, backed by the Spanish government’s Plan Reinicia Auto+; this is a recovery initiative launched in response to the DANA weather event of October 2024, which caused the loss of approximately 120,000 vehicles. The plan provides subsidies of up to €10,000 for new BEVs and PHEVs purchased to replace insured vehicles written off due to DANA. Meanwhile, subsidies for other Euro 6-compliant powertrain types are limited to half that amount. As of March 2025, about 14% of subsidy requests were for BEVs and PHEVs, while HEVs accounted for 40%. The Valencian Community has seen a 141% YTD increase in new BEV registrations compared with the same period in 2024; this is the second-highest growth among Spain’s autonomous regions and the strongest among the country’s largest regional markets. Registrations of PHEVs rose even more sharply, with a 160% increase YTD over the same period in 2024, the highest of all of Spain’s autonomous regions. Moreover, in April 2025, the Spanish government reactivated the MOVES III programme, an incentive scheme aimed at promoting the purchase of new zero- and low-emission vehicles and the installation of private and publicly accessible electric vehicle chargers. Originally launched in 2021, the program was extended (with retroactive effect from January 1) and will remain in force either until the end of 2025 or until the allocated €400 million in funding is exhausted. Incentives for the purchase of new electric vehicles with an electric range exceeding 90 km are €4,500 per vehicle, and that rises to €7,000 if a vehicle older than 7 years is scrapped as part of the transaction. For the installation of chargers, private individuals are eligible to receive 70%–80% of the installation costs.
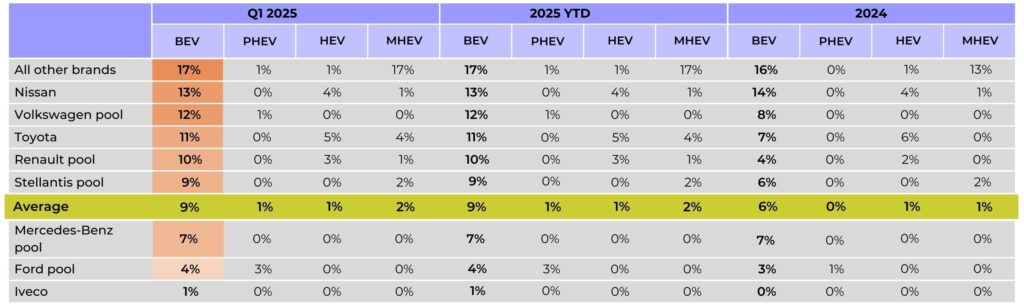
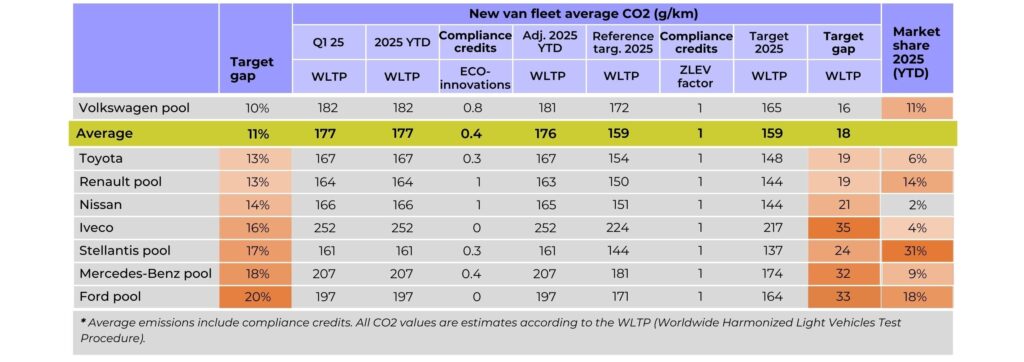
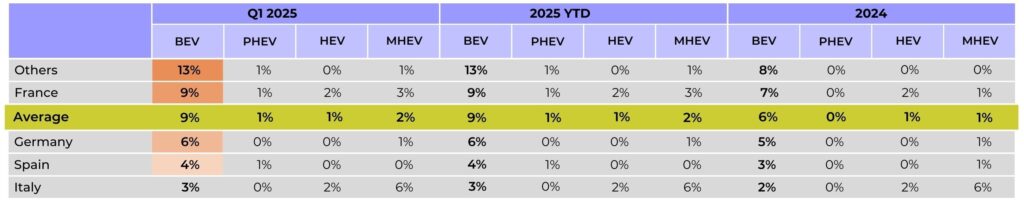
Over 346,000 new vans were registered in Europe in the first quarter of 2025, a 13% decrease over the same period in 2024. Of newly registered vans, 9% were battery electric; in the first quarter of 2024, 6% of new vans were battery electric. Nissan (13%), the Volkswagen pool (12%), Toyota (11%), and the Renault (10%) and Stellantis (9%) pools all had BEV shares at or above the European average; the Mercedes-Benz (7%) and Ford (4%) pools and Iveco (1%) were below the European average. Looking at the largest markets, shares of battery electric vans increased by 1 to 2 percentage points in the first quarter of 2025 compared with the same period in 2024. None of the manufacturers are currently on track to meet their CO2 targets for 2025 and the average target gap is 18 g CO2/km. Among manufacturers and manufacturer pools, Iveco and the Ford and Mercedes-Benz pools are currently the farthest from their 2025 CO2 targets, with respective target gaps of 35, 33, and 32 g CO2/km.
Share of BEV, PHEV, HEV and MHEV by manufacturer pool or large manufacturer not forming a pool
Average CO2 emissions of LCV fleets by manufacturer pool or non-pool manufacturer and market share
New LCV registrations by country

Market shares for BEV, PHEV, HEV and MHEV light commercial vehicles by country
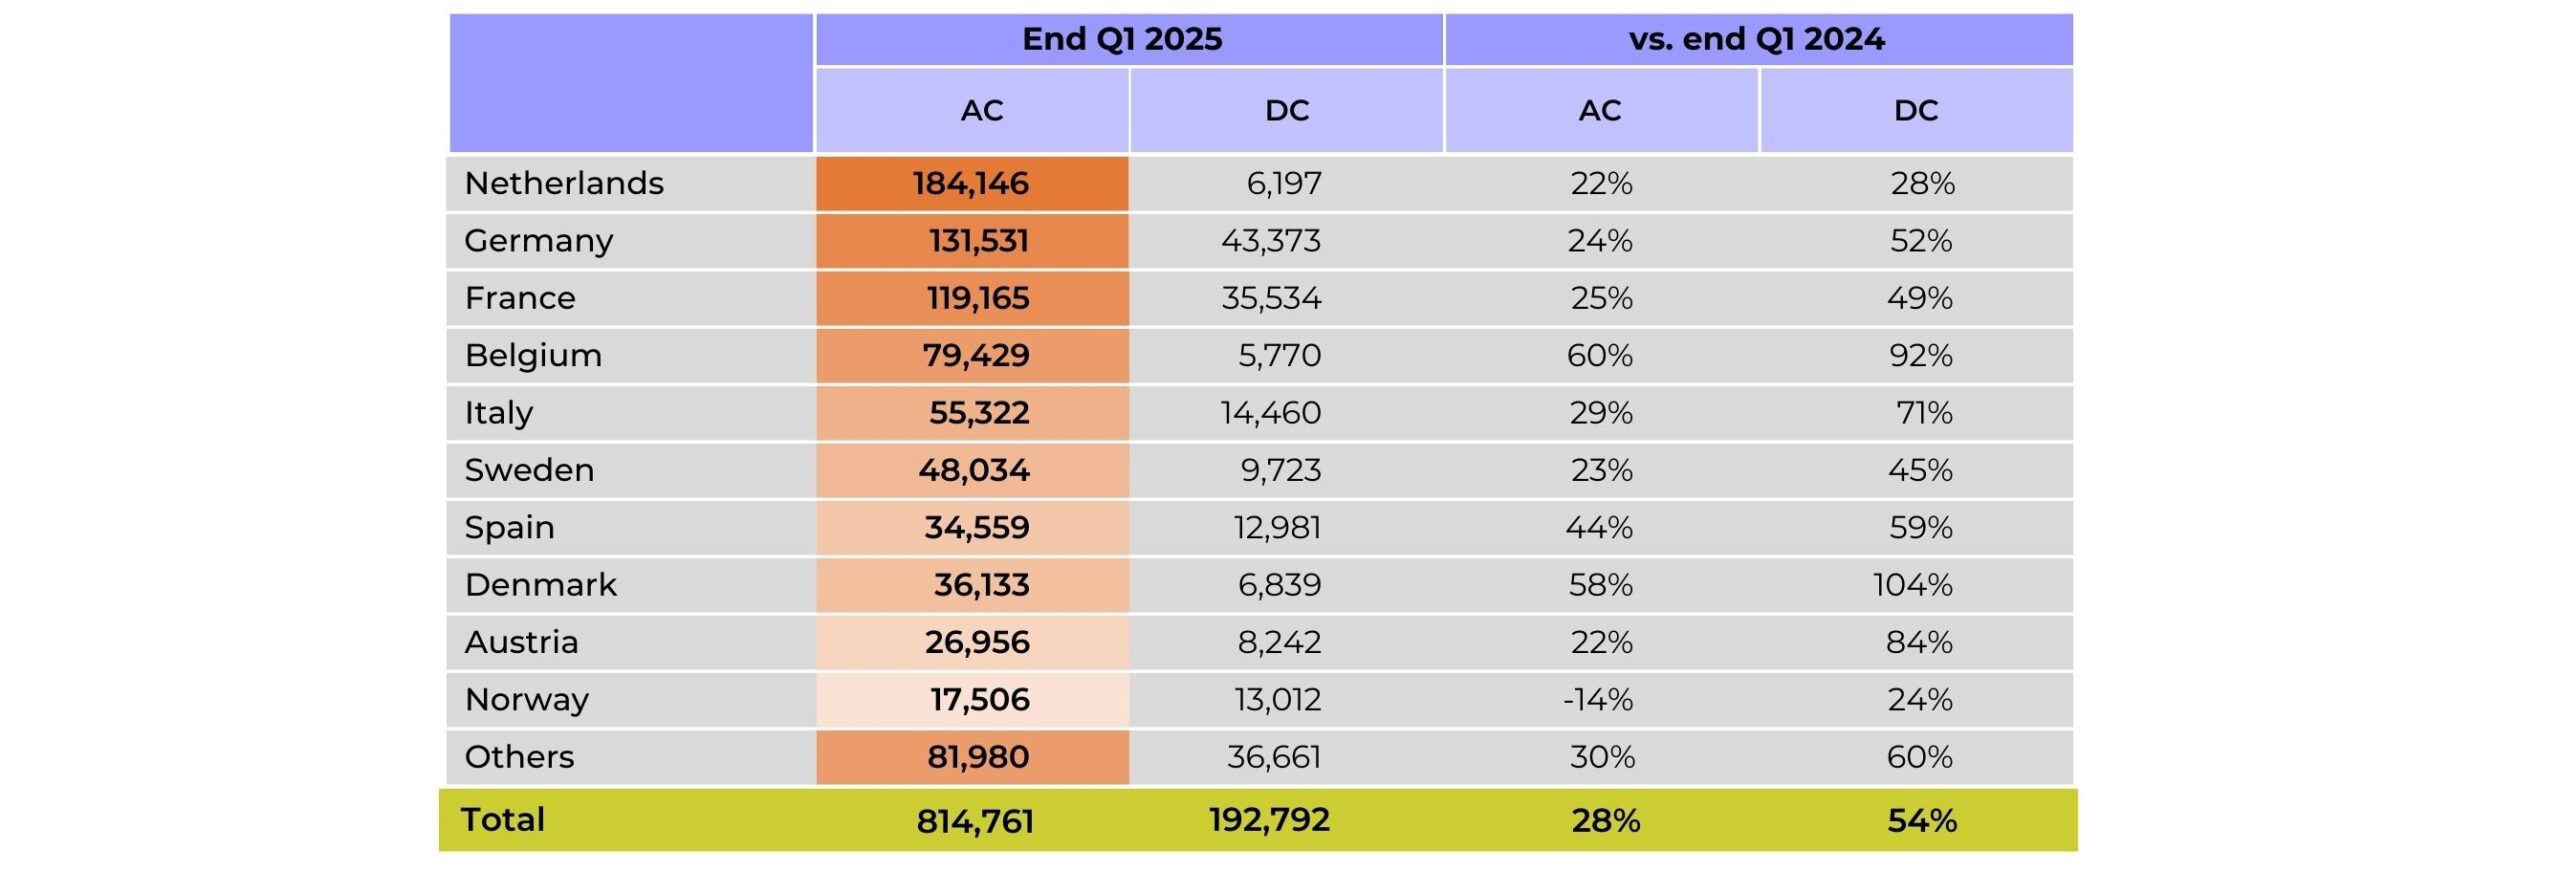
Over 1 million public charging points were installed in Europe by the end of the first quarter of 2025, up from around 950,000 at the end of 2024. For alternating current (AC) charging, this represents a 28% increase compared with the same point in 2024. Direct current (DC) charging points showed even greater growth, increasing 54% compared with the first quarter of 2024. Approximately 81% of Europe’s public charging points supply AC, and the remaining 19% supply DC.
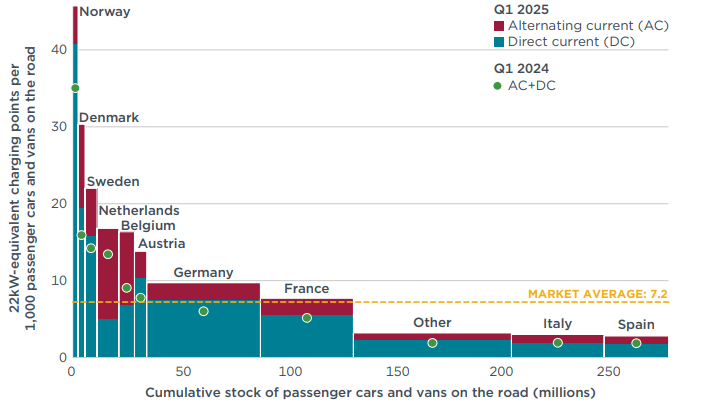
Denmark recorded the largest growth in DC chargers by the end of the first quarter of 2025, +104% compared with the first quarter of 2024, and was followed by Belgium, which recorded a substantial increase in both DC and AC publicly accessible charging points (+92% and +60%, respectively). There were on average about 7.2 publicly accessible 22 kW-equivalent charging points installed per thousand passenger cars and vans on the road in Europe at the end of March 2025, up from 6.5 at the end of 2024. With nearly 46 publicly accessible 22 kW-equivalent charging points per thousand passenger cars and vans, Norway continues to lead Europe in charging infrastructure and is followed by Iceland (35), Denmark (30), and Sweden (22). Italy (3) and Spain (3) remain well below the European average.
22 kW-equivalent publicly accessible charging points installed per thousand passenger cars and vans, by type of power output and country by the end of March 2025
Number of publicly accessible charging points installed, by country and type of power output
A manufacturer pool is an alliance between different automakers who collaborate to jointly meet the CO₂ emission targets set by regulations. In practice, manufacturers can combine the average CO₂ emissions of the vehicles they put on the market, offsetting the excess emissions of some brands with the stronger performance of others within the alliance. This mechanism allows manufacturers to balance their impact and avoid penalties, facilitating compliance with the targets set by the regulation on CO₂ standards. For this publication, the 2025 pools listed in the European Commission’s “M1 pooling list” (cars) and “N1 pooling list” (vans), version of 15 March 2025, are used. 2024 closed pools from these lists have been carried over into 2025, even in the absence of a 2025 formal declaration, as they typically remain stable due to ongoing commercial affiliations (e.g., the BMW, Hyundai, and Kia pools). In contrast, only open pools that have been confirmed for 2025 are included, as their composition tends to change more frequently than closed pools. Additionally, it is assumed that the Renault Group forms closed passenger car and van pools in 2025 with its affiliated manufacturers. For cars, the main brands are: BMW pool (BMW, Mini), Hyundai pool (Hyundai), Kia pool (Kia), Mercedes-Volvo-Polestar pool (Mercedes-Benz, Polestar, Smart, Volvo), Renault pool (Dacia, Renault), Tesla-Stellantis-Toyota pool (Citroën, Fiat, Ford, Jeep, Mazda, Opel, Peugeot, Suzuki, Tesla, Toyota), Volkswagen (Audi, Cupra, Porsche, SEAT, Škoda, VW). For vans, the main brands are: Ford pool (Ford), Mercedes-Benz pool (Mercedes-Benz, Mitsubishi Fuso), Renault pool (Renault), Stellantis pool (Citroën, Fiat, Opel, Peugeot), Volkswagen pool (MAN, Volkswagen). Nissan and SAIC are large passenger car manufacturers not part of a pool. Similarly, Iveco, Nissan, and Toyota are large van manufacturers not part of a pool.
Compliance mechanisms: To facilitate achievement of their CO₂ targets, manufacturers can use different compliance mechanisms: (1) Manufacturers can reduce their CO₂ levels by up to 6 g/km by deploying eco-innovation technologies. As a conservative estimate, we apply the 2023 level of eco-innovation CO₂ reductions per brand. (2) If a manufacturer’s ZLEV (zero and low-emission vehicles) share exceeds 25%, its CO₂ target is increased by the same number of percentage points, up to a maximum of 5%. This adjustment is referred to as the ZLEV factor, while the target before adjustment is called the reference target. The manufacturer’s final target is calculated by multiplying the reference target by the ZLEV factor. ZLEVs include BEVs (battery electric vehicles) and vehicles with CO₂ emissions equal to or below 50 g CO₂/km according to the WLTP cycle.

13 June, 2025

12 June, 2025

12 June, 2025

22 April, 2025

26 February, 2024

22 February, 2024